So two years ago, my library circulation seriously dropped. In my defense, I was being pulled far too often for non-library tasks and meetings. After a long conversation with my admin, last year I was completely left alone and allowed to do my program, unfettered and we ended the year at 16,000 circulations. My school is PreK to 5th grade with 515 students. I was THRILLED.
Please note that my school does not use Accelerated Reader (thankfully), so my statistics truly show a huge increase in students reading for pleasure. This make me happy.
I used Canva to make all of these infographics. I modified templates for some and created the canvas for the others. Each infographic was enlarged and laminated so that I am able to write on them with dry erase markers.
Having these infographics up really kept me and the students on track. Plus, they look really good hanging in the library. Give it a try!

Library Circulation
This infographic is meant to explain what we do and why we do it.

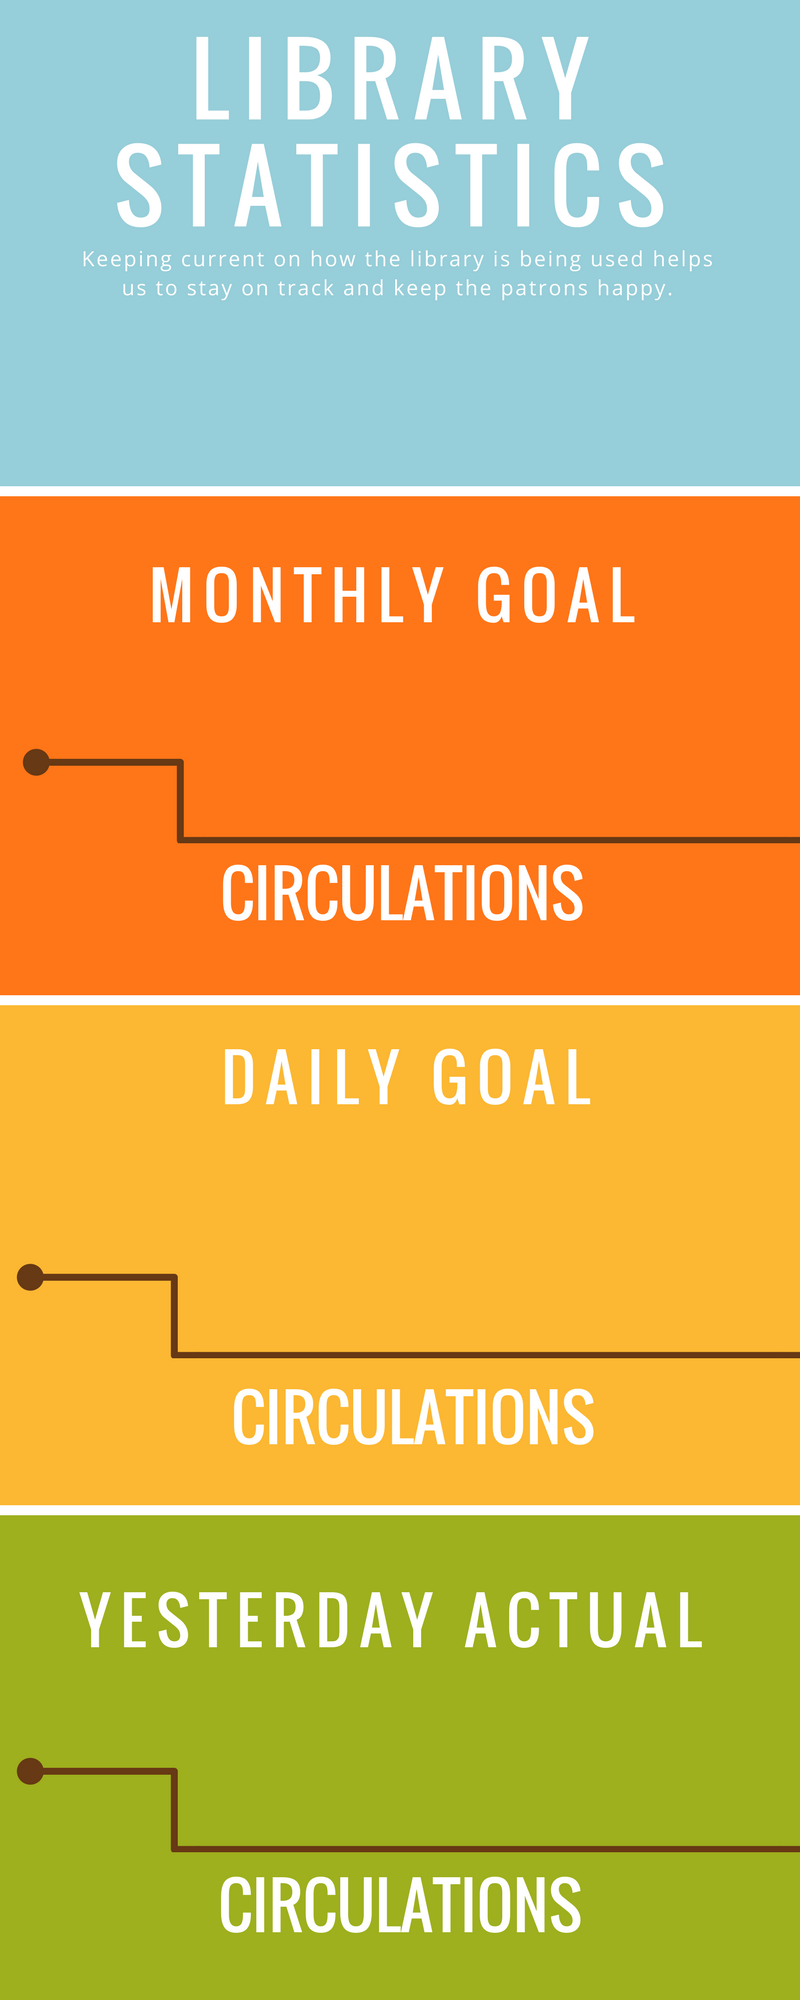
Circulation Goals
This infographic illustrates our goal and makes is palatable to an elementary audience.
Circulation Checkup
This is laminated so I write in month in the blue box and keep track of daily & monthly circulation using a dry-erase marker.

Progress to Goal
This is also laminated. As we reach a milestone, the ruler is colored using a highlighter to keep everyone on track to our yearly goal.